Tired of not understanding if your search resources are idle?

OpenSearch users frequently want to know how their workloads perform in various environments, on various host types, and in various cluster configurations. OpenSearch-benchmark, a community-driven, open-source fork of Rally, is the ideal tool for that purpose. OpenSearch Benchmark helps you to optimize OpenSearch resources usage to reduce infrastructure costs. Such a performance testing mechanism also empowers you to run periodic benchmarks, which can be utilized to discover performance regressions and improve performance. After striving to increase OpenSearch performance in various ways — a subject I discussed in an earlier blog post — benchmarking should be the last step. In this post, I will lead you through the process of setting up OpenSearch-benchmark and running search performance benchmarking between a widely used EC2 instance to a new compute accelerator — the APU by Searchium.ai.
Step 1: Installing Opensearch-benchmark
We’ll be using a m5.4xlarge (us-west-1)EC2 machine on which I installed OpenSearch and indexed a 9.1M sized vector index called laion_text. The index is a subset of the large laion dataset which I converted its text field to a vector representation (using a CLIP modal):
Install Python 3.8+ including pip3, git 1.9+ and an appropriate JDK to run OpenSearch. Be sure that JAVA_HOME points to that JDK. Then run the following command:
sudo python3.8 –m pip install opensearch–benchmarkInstall Python 3.8+ including pip3, git 1.9+ and an appropriate JDK to run OpenSearch. Be sure that JAVA_HOME points to that JDK. Then run the following command:
TIP: You might need to manually install each dependency.
sudo apt install python3.8–dev
sudo apt install python3.8–distutils
python3.8 –m pip install multidict –upgrade
python3.8 –m pip install attrs — upgrade
python3.8 –m pip install yarl –upgrade
python3.8 –m pip install async_timeout –upgrade
python3.8 –m pip install charset_normalizer –upgrade
python3.8 –m pip install aiosignal — upgrade
Run the following to verify that the installation was successful:
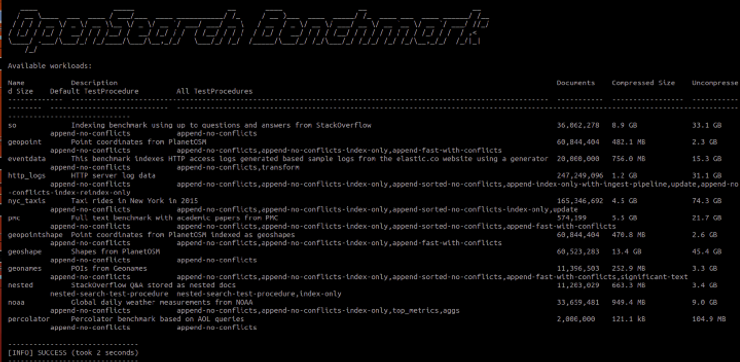
opensearch-benchmark list workloads You should see the following details:
Step 2: Configure where you want the reporting to be saved
Opensearch-benchmark reports by default to “in-memory”. If set to “in-memory”, all metrics will be kept in memory while running the benchmark. If set to “opensearch”, all metrics will instead be written to a persistent metrics store and the data will be available for further analysis. In order to save the reported results in your OpenSearch cluster, we will open the opensearch-benchmark.ini file, which can be found in the ~/.benchmark folder and then modify the results publishing section in the highlighted area to write to the OpenSearch cluster:
Step 3: Construct our search workload
Now that we have opensearch-benchmark installed properly it’s time to start benchmarking! The plan is to benchmark search between two different compute devices. You can use the following method to benchmark and compare any instance that you wish. In this example we will test out a commonly used KNN flat search on a single node and single shard configuration (an ANN example using IVF and HNSW and more sophisticated configuration will be covered in my next blogpost) and compare a m5.4xlarge EC2 instance to a compute device named the APU. Access to that hardware is possible when using Searchium.ai’s SaaS platform which offers a plugin that knows to perform the search. You can test out the whole process on your own environment and data, as there is a free trial available and registration is simple. Each test/track in opensearch-benchmark is called a “workload”. We will create a workload for searching on the m5.4xlarge, which will act as our baseline. And we will create a workload for searching on the APU, which will act as our contender. We will ultimately compare both workloads and see how their performance compares. Let’s start with creating a workload for both the m5.4xlarge (CPU) and APU using the laion_text index (make sure that you run these commands from within the “.benchmark” directory):
opensearch–benchmark create–workload —workload=laion_text_cpu —target–hosts=localhost:9200 —indices=“laion_text”
opensearch–benchmark create–workload —workload=laion_text_apu —target–hosts=localhost:9200 —indices=“laion_text”
NOTE: The workloads might be saved in a “workloads” folder in your “home” folder, you will need to copy them to the .benchmark/benchmarks/workloads/default directory.
Run opensearch-benchmark list workloads again and see that both laion_text_cpu and laion_text_apu are listed.
Next, we will start adding operations to the test schedule. In this section you can add as many benchmarking tests as you want. Every test should be added to the schedule in the workload.json file which can be found within the folder with the index name you wish to benchmark.
In our case it can be found in: ./benchmark/benchmarks/workloads/default/laion_text_apu and: ./benchmark/benchmarks/workloads/default/laion_text_cpu
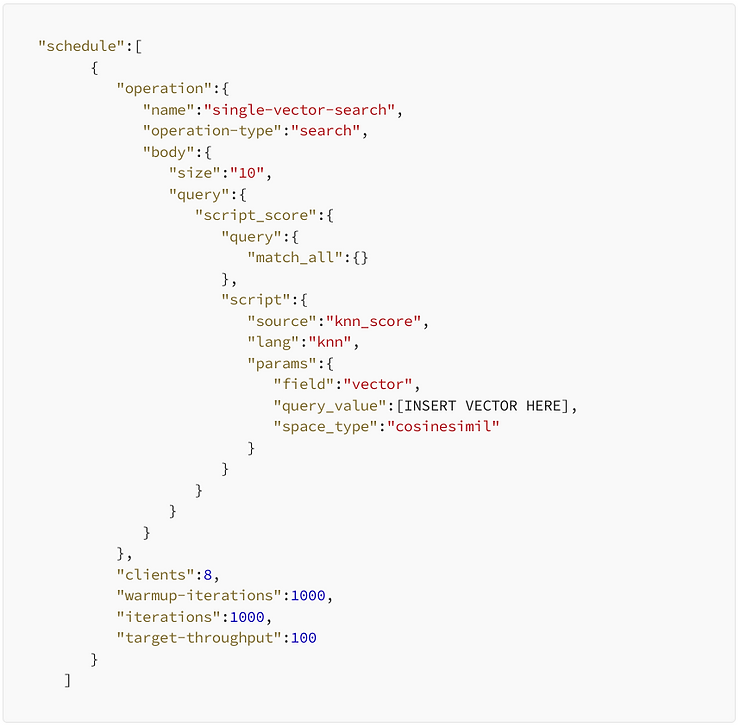
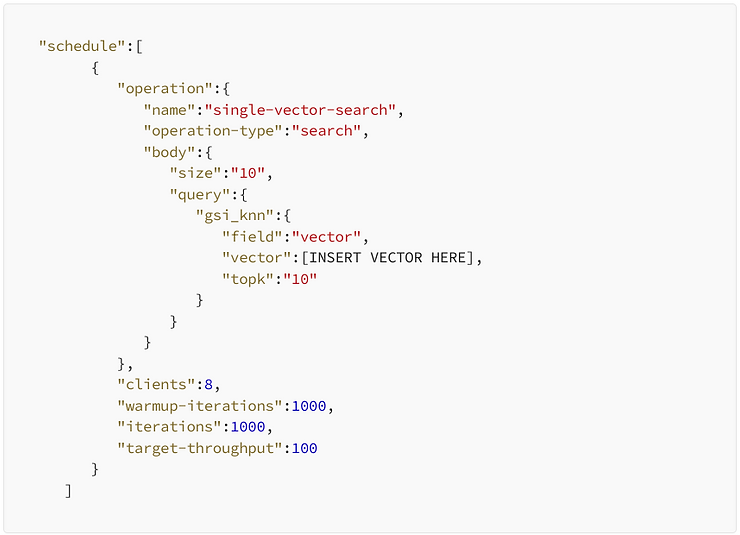
We want to test out our OpenSearch search. We will create an operation named “single vector search” and include a query vector. I cut out the vector itself because a 512 dimension vector would be a bit long… Simply add in the desired query vector, but remember to copy the same vector to both m5.4xlarge (CPU) and APU workload.json files!
Next, add any parameters you want. In this example I am going to stick with the default 8 clients and 1000 iterations.
m5.4xlarge (CPU) workload.json:
APU workload.json:
Step 4: run our workloads
It’s time to run our workloads! We are interested in running our search workloads on a running OpenSearch cluster. I added a few parameters to the execute_test command:
Distribution-version — Make sure to add your correct OpenSearch version. Workload — Our workload name. (There are other parameters available, I added the pipeline, client-options and on-error which simplify the whole process)
opensearch–benchmark execute_test —distribution–version=2.2.0 —workload=laion_text_apu —pipeline=benchmark–only —client–options=verify_certs:false,use_ssl:false —on–error=abort —client–options=“timeout:320”
opensearch–benchmark execute_test —distribution–version=2.2.0 —workload=laion_text_cpu —pipeline=benchmark–only —client–options=verify_certs:false,use_ssl:false —on–error=abort —client–options=“timeout:320”
And now we wait…
Bonus benchmark: I was interested to see the results on an Arm-based Amazon Graviton2 processor, so I ran the same exact process on an r6g.8xlarge EC2 as well.
Step 5: Compare our results
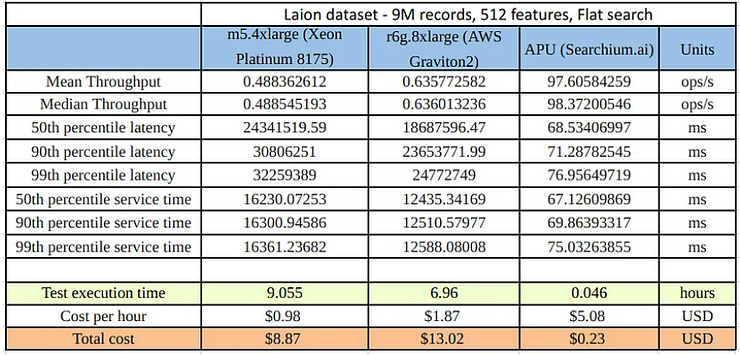
We are finally ready to look at our test results. Drumrolls please… 🥁 So, first of all, the running times of each workload were different. The m5.4xlarge (CPU) workload took 9.055 hours, while the APU workload took 2.78 minutes (195 times faster). This is thanks to the fact that the APU supports asynchronous querying, allowing for greater throughput.
We now want to compare both workloads properly. OpenSearch-benchmark provides us with the ability to generate a CSV file where we can see comparisons between workloads easily. To do just that, we will first need to find both workload IDs. This can be done by either looking in the OpenSearch benchmark-test-executions index (which was created thanks to step 2), or in the benchmarks folder:
Next, we will copy those IDs, compare the two workloads, and display the output in a CSV file:
opensearch–benchmark compare —results–format=csv —show–in–results=search —results–file=data.csv —baseline=ecb4af7a–d53c–4ac3–9985–b5de45daea0d —contender=b714b13a–af8e–4103–a4c6–558242b8fe6a
Here is a short summary of the results we got:
A brief explanation of the results in the table:
1.Throughput: The number of operations that OpenSearch can perform within a certain time period, usually per second.
2. Latency: The time period between the submission of a request and receiving the complete response. It also includes wait time, i.e., the time the request spends waiting until it is ready to be serviced by OpenSearch.
3. Service time: The time between sending a request and receiving the corresponding response. This metric can easily be mixed up with latency but does not include waiting time. This is what most load testing tools refer to as “latency” (although it is incorrect).
4. Test execution time: the total runtime since the workload has been started to final completion.
Conclusion
When looking at our results, we can see that the service time in the APU workload is 181 times faster than the m5.4xlarge workload. Putting this into a cost perspective, we can see that running the same workload on the APU cost us $0.23 as opposed to $8.15 on the m5.4xlarge (which is 35 times cheaper), and we got our search results almost 9 hours earlier. Now just imagine the magnitude of this when scaling to even larger datasets, which in our data-driven, fast-paced world is likely to be the case. I hope this helped you understand more about the power of OpenSearch’s benchmarking tool and how you can use it to benchmark your search performance.
A huge thanks to Dmitry Sosnovsky and Yaniv Vaknin for all of their help!


